Blog
Explore my blog on creating web-based sports dashboards, showcasing interactive visualizations, responsive layouts, and practical examples of applying data to real-world problems.
Create your own sportive dashboard!
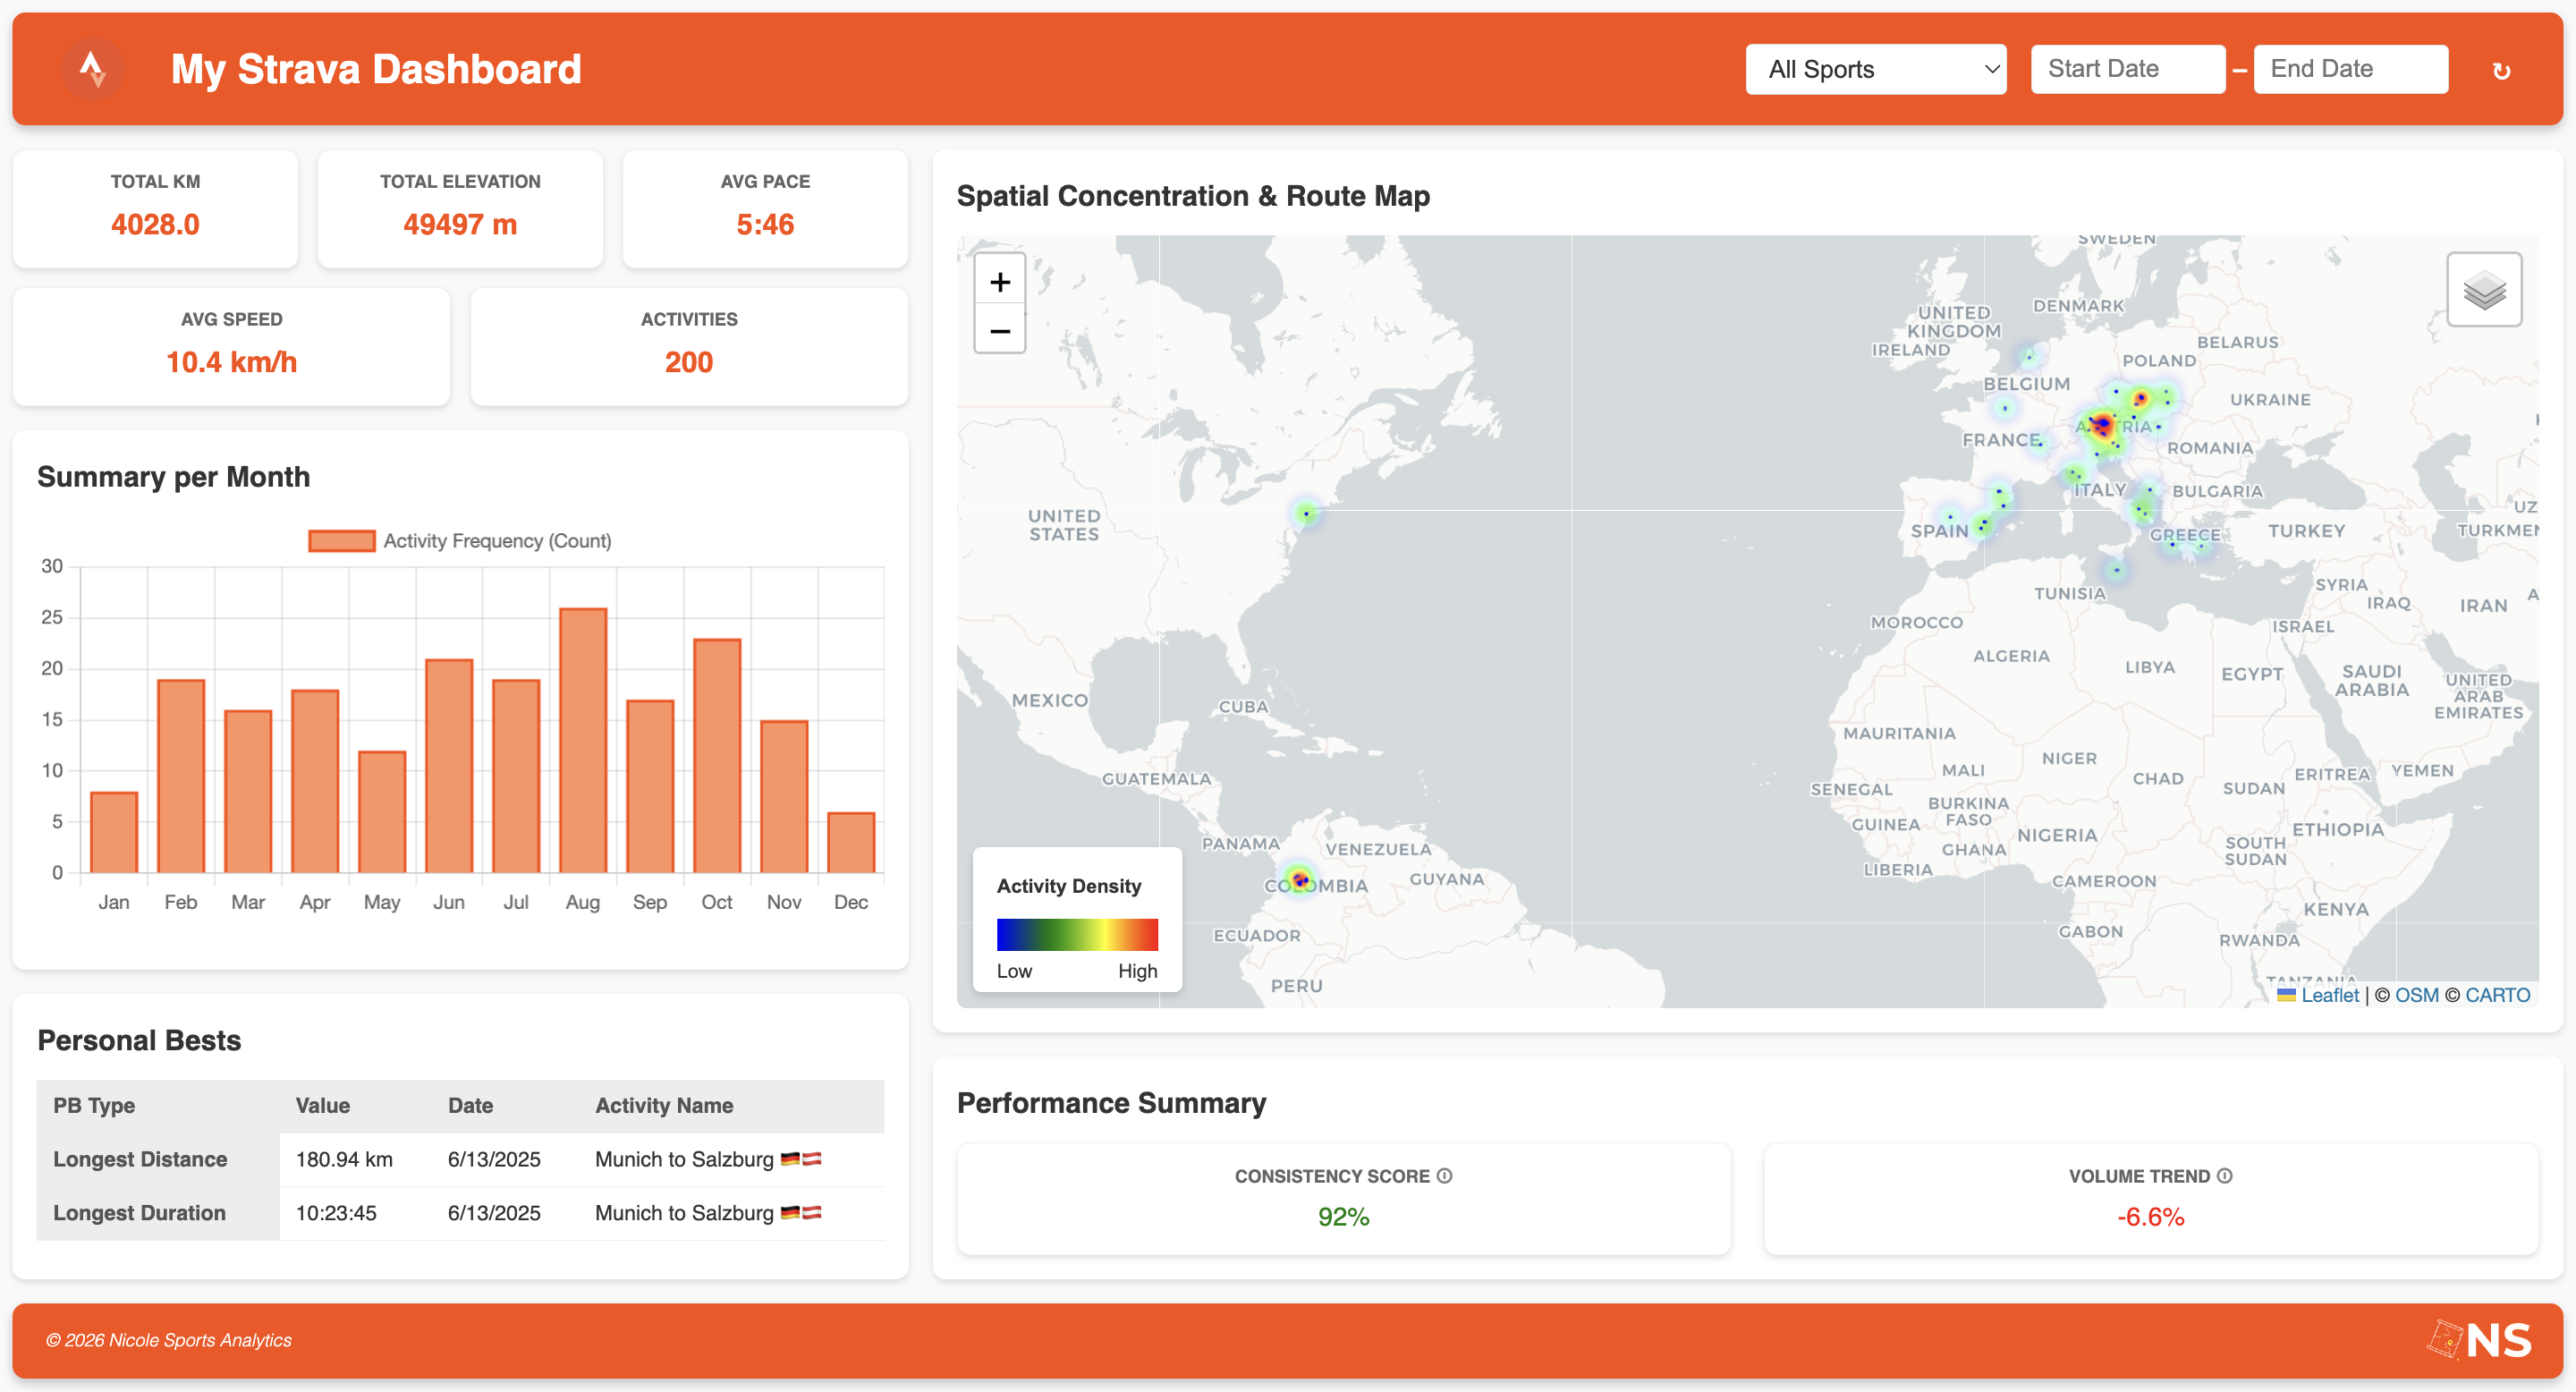
This article explores the development of a web-based sports tracking dashboard, focusing on data visualization, platform integration, and responsive design for performance monitoring.
Feb 18, 2026
View Project
Getting you sportive data from Strava - API
A Jupyter Notebook dashboard using the Strava API to analyze and visualize physical activity data. It provides interactive insights on workout patterns, performance metrics, and spatial activity distribution, helping athletes and fitness enthusiasts track progress and explore trends.
Aug 22, 2025
View Project