JavaScript is one of the programming languages most people rely on when it comes to web, mobile, and desktop app development. Its wide range of libraries and documentation make it a sustainable source to start building customized solutions like data visualization applications, which are perfect examples of JavaScript-based dashboards.
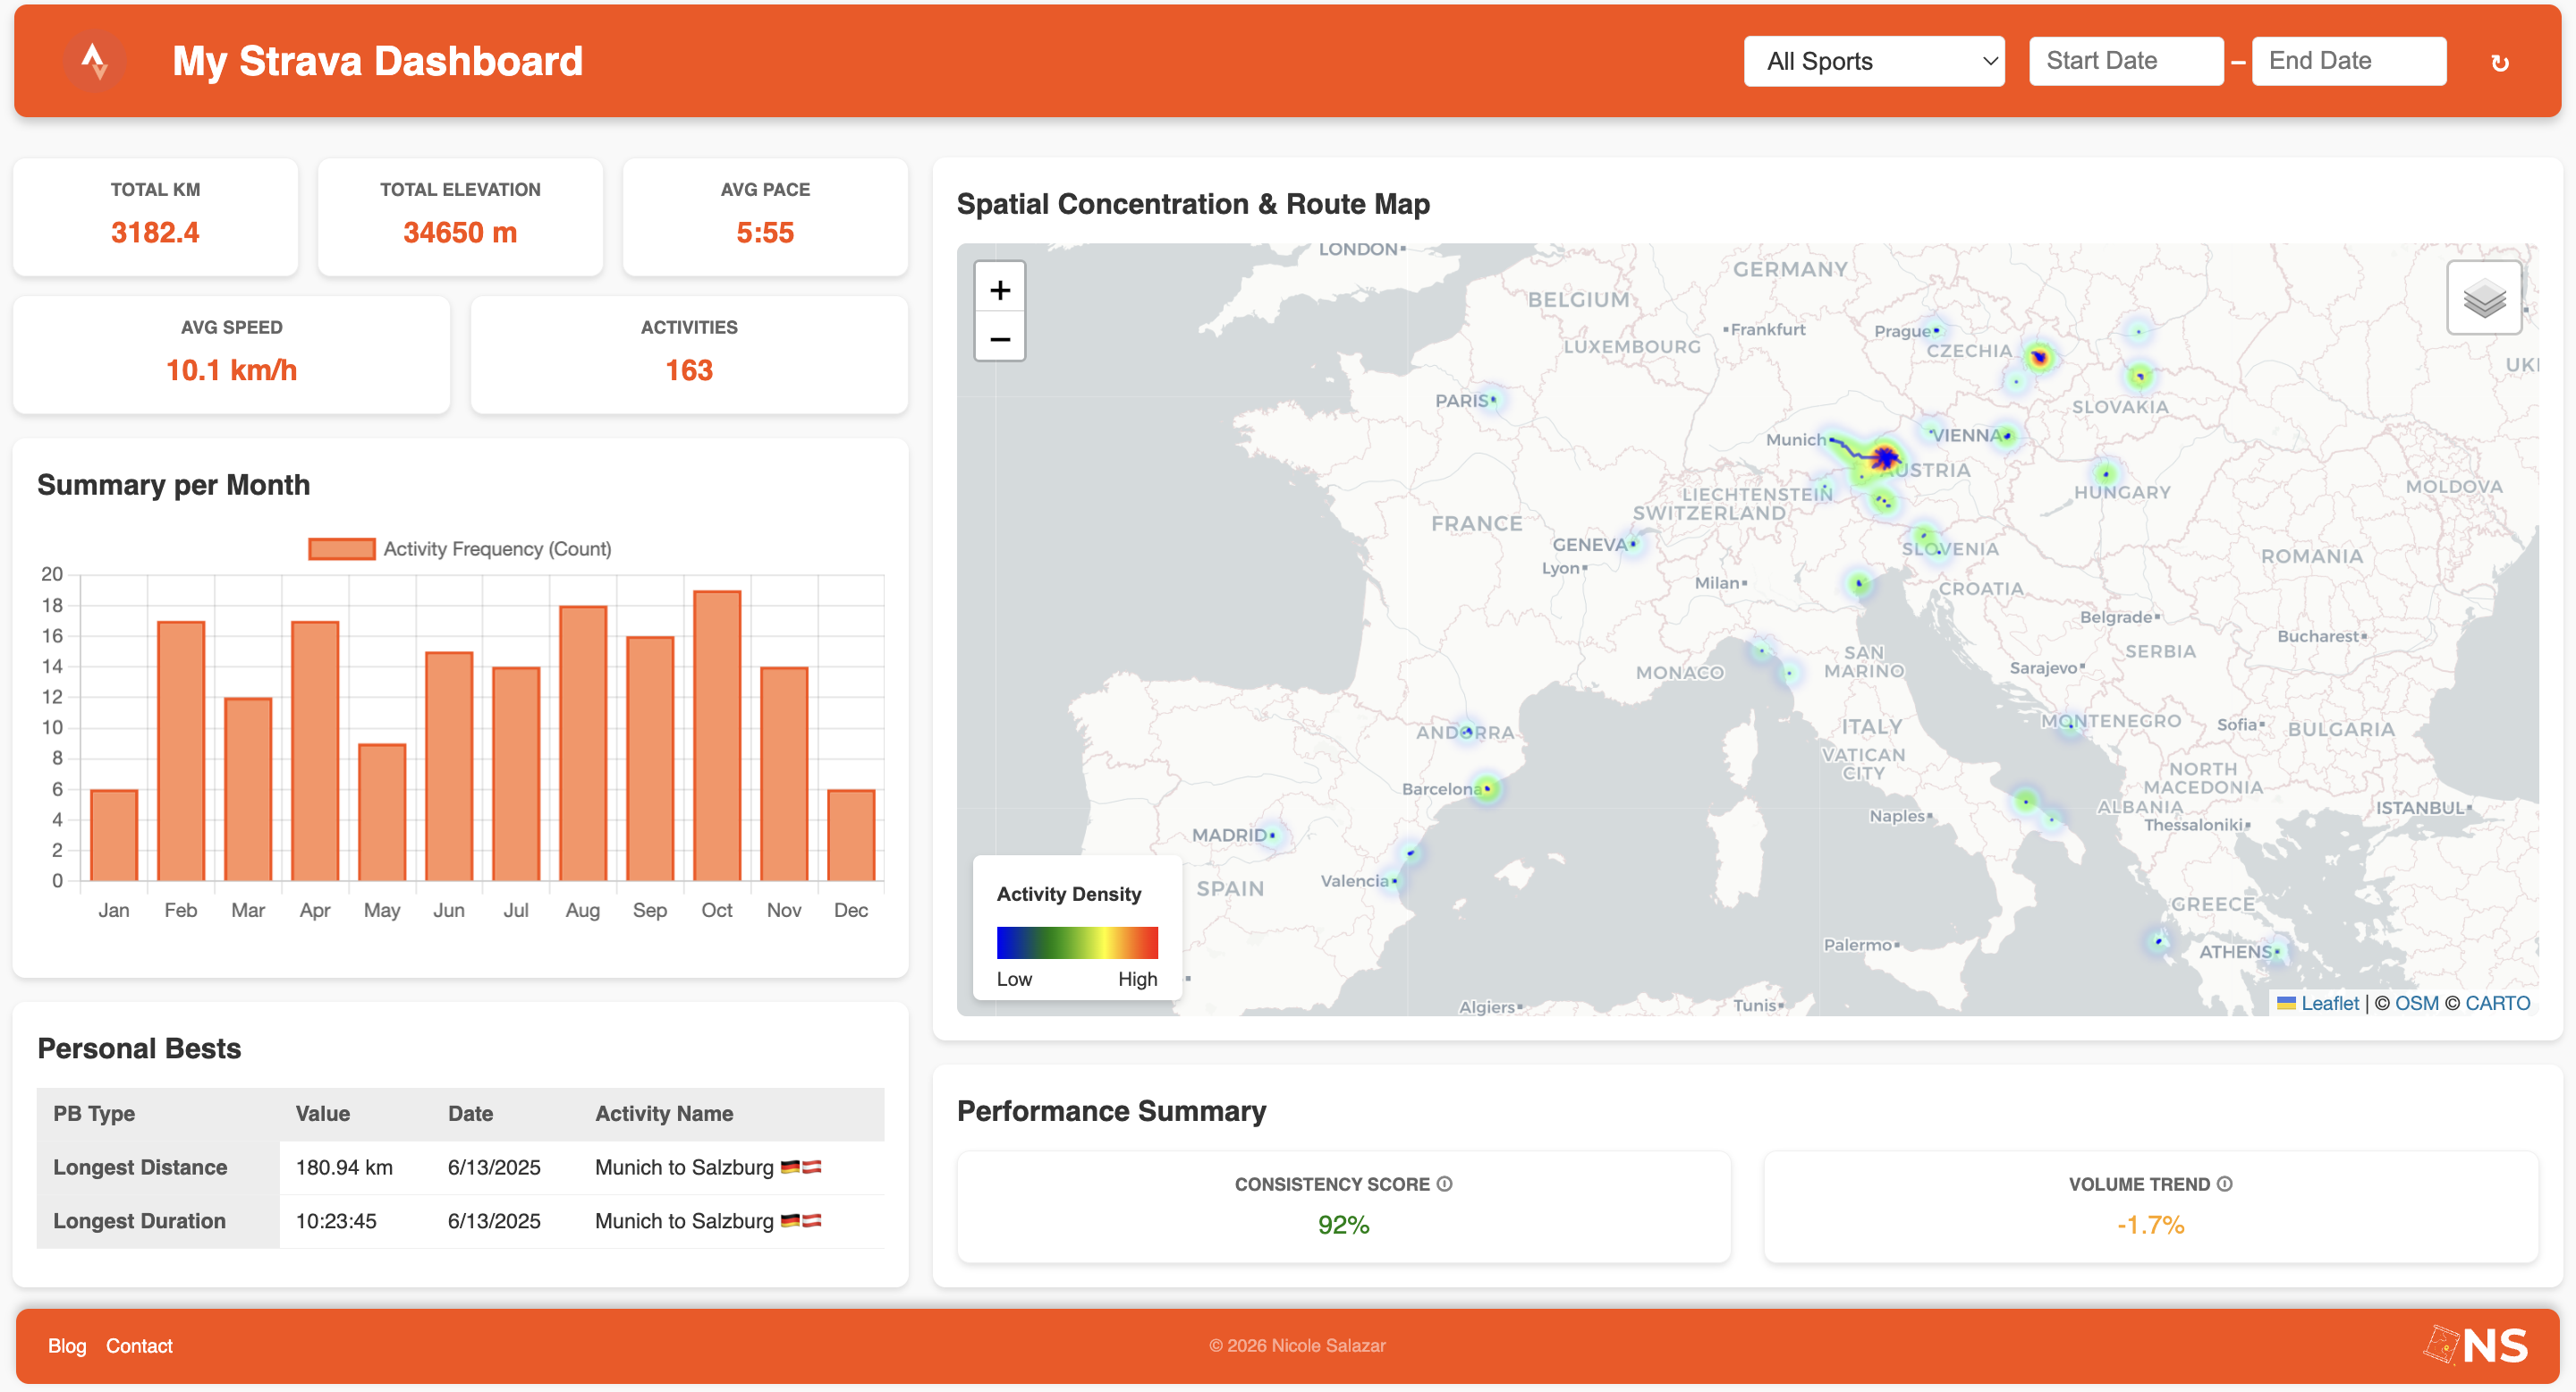
This article provides a step-by-step guide to create a JavaScript-based dashboard for sport tracking that displays key insights about performance both statistically and spatially. It covers HTML structure, CSS styling, and dynamic functionality through JavaScript.
Step 0 – Environment Preparation
Set up all tools and dependencies needed for the project. Install Live Server in Visual Studio Code to enable real-time previews.
Installation guide: Live Server in VS Code
Once installed, the Go Live button appears in VS Code for live previews.

Step 1 – JavaScript Project Architecture
Create a folder named my-strava-dashboard containing three files:
 my-strava-dashboard/
  ├── index.html
  ├── style.css
└── script.js - index.html: File containing the blueprint of the application (it is mandatory to keep the name as stated for the application to work online correctly).
- style.css: File where all the style and design specifications code go (sizes, color, text fonts, spaces, and so on).
- script.js: File allocating all the behavior of the app (buttons, data handlers, actions, rendering, etc.).
Include CSS and JS correctly in HTML.
Step 2 – Building the Skeleton
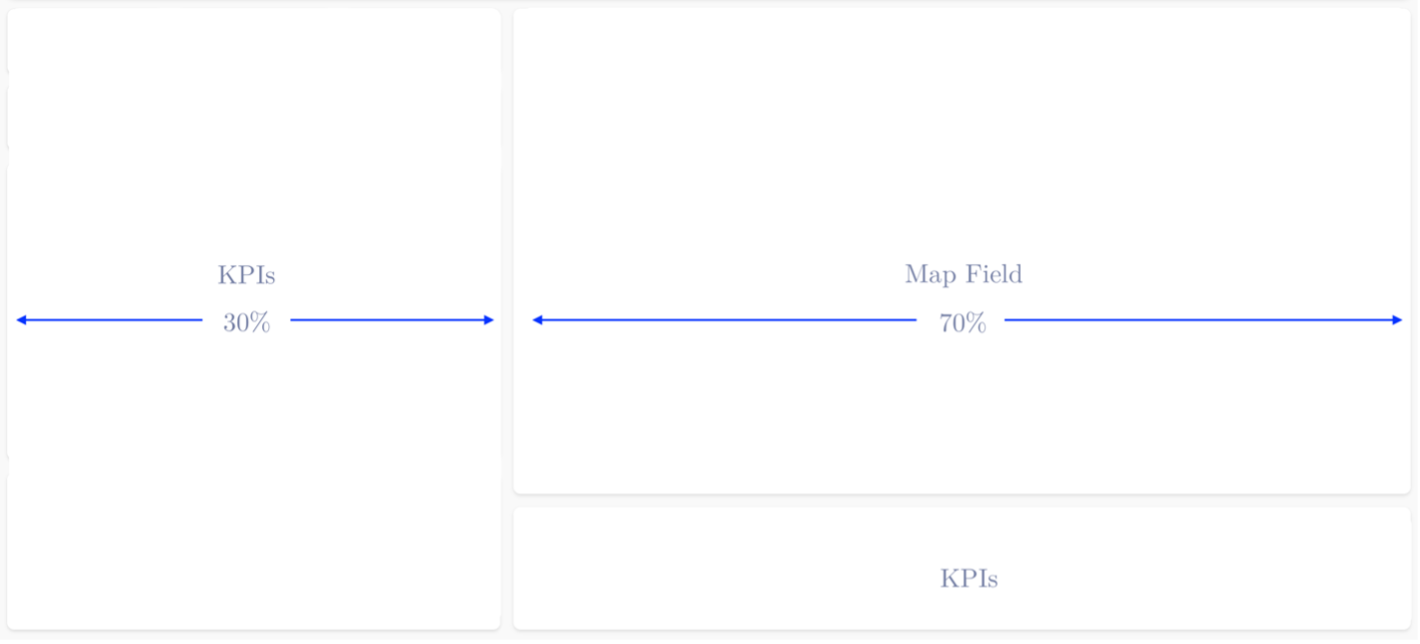
Plan the dashboard layout for spatial focus. HTML consists of two main sections:
 The file distribution defines the overall framework of the app and its CSS design configuration. The order of elements matters, as they will be displayed in a structured and organized way.
The HTML consists of two primary sections:
The <head> section
This first portion of code holds essential metadata, external sources,
and the stylesheet dependency (style.css) of the app.
<head>
    <meta charset="utf-8" />
    <title>My Strava Dashboard</title>
    <meta name="viewport" content="width=device-width, initial-scale=1.0">
    <link rel="stylesheet" href="https://unpkg.com/leaflet/dist/leaflet.css" />
    <link rel="stylesheet" href="style.css" />
</head>
The <body> section
This section defines the frontend displayed when rendering the application in the browser. It consists of a single div container holding the elements to show online. In this case, the body encompasses the following elements:
- Banner + Filters
- Main Dashboard Content
- Left Column: KPIs (three pill metrics, a graph and a table)
- Right Column: Map
- External Dependencies
- Script
Banner
Holds the title, the sport filter and a refresh button for the filter.
<!-- Banner -->
<header id="topBanner">
    <div class="title">My Sport Dashboard</div>
    <div class="filters">
        <!-- Filter by sport (Dropdown Menu) -->
        <div class="filter-group">
            <select id="sportFilter">
                <option value="all">All Sports</option>
            </select>
        </div>

        <!-- Refresh all filters button -->
        <button id="refreshFilters" class="icon-button" title="Reset Filters">
            ↻
        </button>
    </div>
</header>
Main Content
<!-- Main dashboard content - Left & right columns -->
<div id="main-dashboard-content">
    <!-- KPIs left column -->
    <div id="left-column">
        <div class="kpi-group">
            <div class="pill" title="Total mileage in selected range">
                <div>Total KM</div>
                <div class="k" id="kpi-distance"></div>
            </div>
            <div class="pill" title="Total Elevation Gain">
                <div>Total Elevation</div>
                <div class="k" id="kpi-elev"></div>
            </div>
            <div class="pill" title="Average Pace">
                <div>Avg Pace</div>
                <div class="k" id="kpi-pace">8:55 min/km</div>
            </div>
        </div>

        <div class="card chart-card">
            <h3>Summary per Month</h3>
            <canvas id="activityChart" style="width:100%; height:250px;"></canvas>
        </div>

        <div class="card table-card">
            <h3>Personal Bests</h3>
            <div id="personal-bests-table-container">
                <table id="personal-bests-table">
                    <thead>
                        <tr>
                            <th>Date</th>
                            <th>Name</th>
                            <th style="text-align: right;">Total Distance (km)</th>
                            <th style="text-align: right;">Elapsed Time</th>
                        </tr>
                    </thead>
                    <tbody>
                    </tbody>
                </table>
            </div>
        </div>
    </div>
    <!-- KPIs right column -->
    <div id="right-column">
        <!-- Map Canvas -->
        <div class="card map-card">
            <h3>Spatial Concentration & Route Map</h3>
            <div id="map" style="width:100%; height:480px; border:none;"></div>
        </div>
    </div>
</div>
External dependencies and Script
<script src="https://unpkg.com/leaflet/dist/leaflet.js"></script>
<script src="https://cdn.jsdelivr.net/npm/papaparse@5.4.1/papaparse.min.js"></script>
<script src="https://cdn.jsdelivr.net/npm/@mapbox/polyline@1.1.1/src/polyline.min.js"></script>
<script src="https://unpkg.com/leaflet.heat/dist/leaflet-heat.js"></script>
<script src="https://cdn.jsdelivr.net/npm/chart.js"></script>
<link rel="stylesheet" href="https://cdn.jsdelivr.net/npm/flatpickr/dist/flatpickr.min.css">
<script src="https://cdn.jsdelivr.net/npm/flatpickr"></script>
<!-- Functionalities -->
<script src="script.js"></script>
This is the actual look of the application after building just the HTML file:
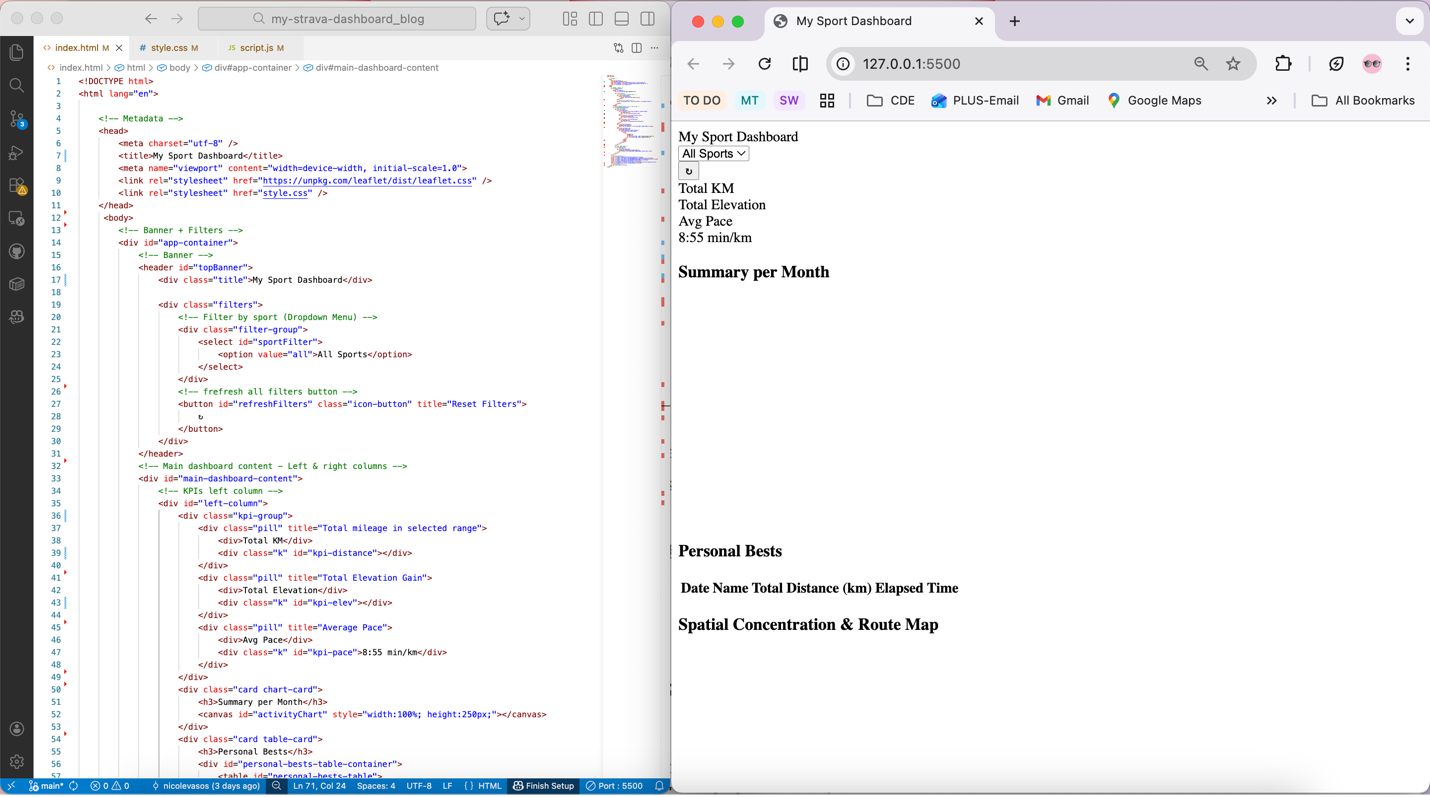
It’s worth mentioning that there are multiple ways to run the application. One of the simplest alternatives is to open the index.html file on a web browser by simply double-clicking on it. However, this approach may not work for all the scripts.
This is why the recommended approach and the most reliable one is to open the project directly in VS Code and run the Live Server to see the changes on the fly. As evident in the image above, the app lacks structure and design, which opens room for the next step.
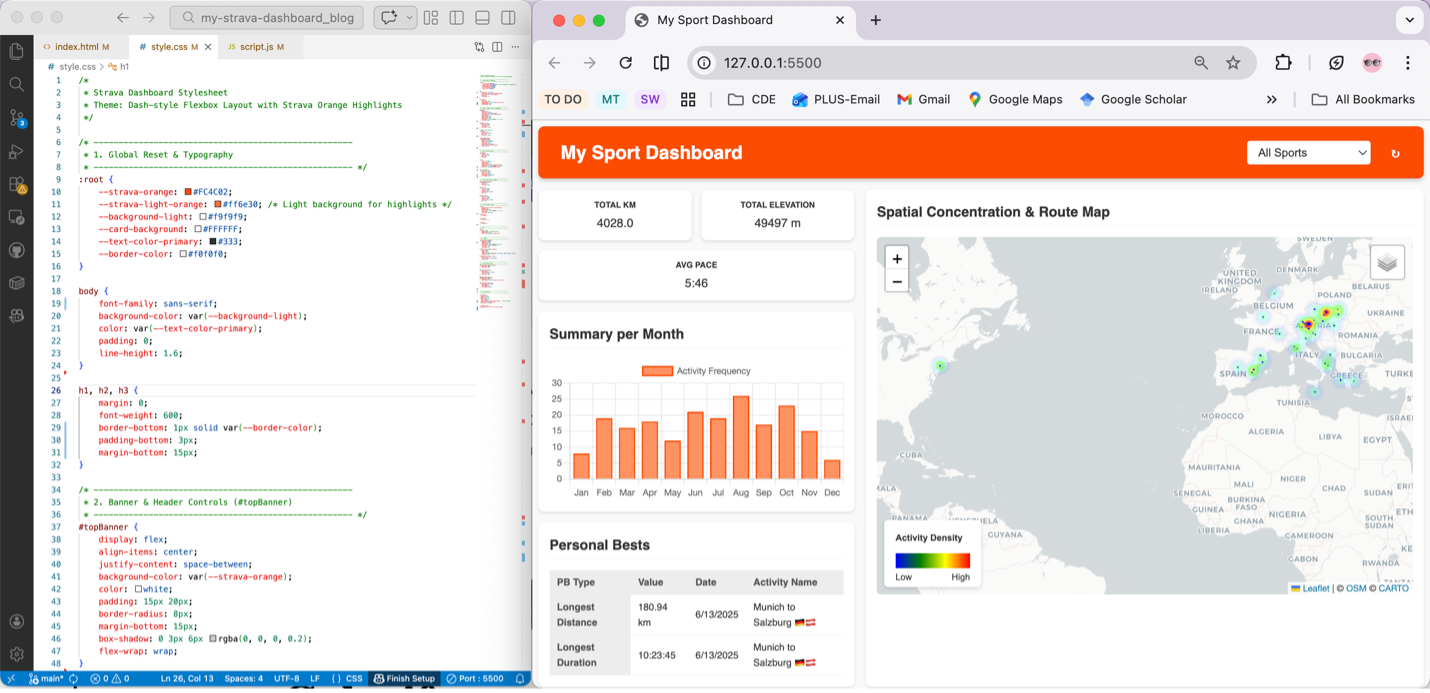
Step 3 – Adding Some Design
As was mentioned before, the CSS holds the style of the application. It contains attributes like color schemes, font family, style, size, and the overall specifications for the layout.
Unlike the HTML file, the order of CSS rules doesn’t affect the position of elements on the page. However, it’s still important to follow a logical sequence to ensure readability and replicability.
The CSS for the dashboard consists of the following elements:
- Global Variables & Typography
- Banner & Header Controls
- KPI Card Styles (pills)
- Main Content Layout (left & right columns)
- Card & Container styling
- Map Dimensions
- Legend styling
- Table styling
CSS order does not affect layout, but a logical sequence improves readability.
/* ----------------------------------------------------
 * 1. Global Reset & Typography
 * ---------------------------------------------------- */
:root {
    --strava-orange: #FC4C02;
    --strava-light-orange: #ff6e30; /* Light background for highlights */
    --background-light: #f9f9f9;
    --card-background: #FFFFFF;
    --text-color-primary: #333;
    --border-color: #f0f0f0;
}

body {
    font-family: sans-serif;
    background-color: var(--background-light);
    color: var(--text-color-primary);
    padding: 0;
    line-height: 1.6;
}

h1, h2, h3 {
    margin: 0;
    font-weight: 600;
    border-bottom: 1px solid var(--border-color);
    padding-bottom: 3px;
    margin-bottom: 15px;
}

/* ----------------------------------------------------
 * 2. Banner & Header Controls (#topBanner)
 * ---------------------------------------------------- */
#topBanner {
    display: flex;
    align-items: center;
    justify-content: space-between;
    background-color: var(--strava-orange);
    color: white;
    padding: 15px 20px;
    border-radius: 8px;
    margin-bottom: 15px;
    box-shadow: 0 3px 6px rgba(0, 0, 0, 0.2);
    flex-wrap: wrap;
}

#topBanner .title {
    font-size: 25px;
    font-weight: 700;
    flex-grow: 1;
    margin-left: 10px;
}

/* Header Filter Styling */
.filters {
    display: flex;
    align-items: center;
    gap: 15px;
    font-size: 0.96em;
}

.filter-group select,
.filter-group input {
    padding: 6px 10px;
    border: 1px solid #ddd;
    border-radius: 4px;
    font-size: 1.0em;
    background-color: white;
    color: var(--text-color-primary);
    outline: none;
}

.icon-button {
  font-size: 20px;
  padding: 8px 12px;
  border: none;
  border-radius: 8px;
  cursor: pointer;
  background-color: var(--strava-orange);   /* Strava orange */
  color: var(--card-background);
  transition: 0.2s ease;
}

.icon-button:hover {
  background-color: var(--strava-light-orange);
}


/* ----------------------------------------------------
 * 3. KPI Card Style (Pills)
 * ---------------------------------------------------- */
.kpi-group {
    display: flex;
    flex-wrap: wrap;
    gap: 12px;
    padding: 0;
}

.pill {
    flex: 1 1 120px;
    text-align: center;
    padding: 10px;
    border-radius: 8px;
    background-color: var(--card-background);
    box-shadow: 0 2px 4px rgba(0, 0, 0, 0.1);
    border: 1px solid var(--border-color);
}

/* KPIs Headers */
.pill div:first-child {
    font-size: 11px;
    margin: 1px 0 3px 0;
    font-weight: 500;
    text-transform: uppercase;
    font-weight: bold;
}

/* ----------------------------------------------------
 * 4. Main Content Layout (Flexbox)
 * ---------------------------------------------------- */
#main-dashboard-content {
    display: flex;
    gap: 15px;
    flex-wrap: wrap;
}

#left-column {
    flex: 1 1 400px;
    min-width: 350px;
    display: flex;
    flex-direction: column;
    gap: 15px;
}

#right-column {
    flex: 2 1 700px;
    min-width: 400px;
    display: flex;
    flex-direction: column;
    gap: 15px;
}

/* ----------------------------------------------------
 * 5. Card & Container Styles
 * ---------------------------------------------------- */
.card {
    background-color: var(--card-background);
    padding: 15px;
    border-radius: 8px;
    box-shadow: 0 2px 4px rgba(0, 0, 0, 0.1);
    width: 100%;
    box-sizing: border-box;
}
.chart-card {
    flex-grow: 0.5;
}

.table-card {
    flex-grow: 0.5;
}

.map-card {
    flex-grow: 1;
}

/* ----------------------------------------------------
 * 6. Map
 * ---------------------------------------------------- */
#map {
    width: 100%;
    height: 600px; /* Desktop Height */
    border-radius: 6px;
    border: 1px solid var(--border-color);
}


/* ----------------------------------------------------
 * 6.1. Legend
 * ---------------------------------------------------- */
.leaflet-control-legend {
    background: white;
    padding: 5px 15px;
    border-radius: 5px;
    box-shadow: 0 2px 5px rgba(0,0,0,0.15);
    font-family: Arial, sans-serif;
    font-size: 12px;
    line-height: 1.3;
}
.leaflet-control-legend .gradient {
    width: 100px;
    height: 20px;
    margin: 5px 0;
    background: linear-gradient(to right, blue, green, yellow, red);
    display: block;
}
.leaflet-control-legend .labels {
    display: flex;
    justify-content: space-between;
    width: 100px;
}

/* ----------------------------------------------------
 * 7. Personal Bests Table
 * ---------------------------------------------------- */
#personal-bests-table-container {
    max-height: 250px;
    overflow-y: auto;
}

#personal-bests-table {
    width: 100%;
    border-collapse: collapse;
    font-size: 13px;
    text-align: left;
}

#personal-bests-table th,
#personal-bests-table td {
    padding: 6px 10px;
    border-bottom: 1px solid var(--border-color);
}

#personal-bests-table th {
    background-color: #eee;
    color: #555;
    font-weight: 600;
    text-transform: none;
}
Now the blueprint established at the beginning is there. But then, what does it happen when interacting with the buttons? -Nothing-. Right. This is precisely where the JavaScript comes to action.
Step 4 – Defining Dynamic Behaviour
As the HTML and the CSS respond exclusively to the frontend structure, the JS holds the functions, the main basis on interaction.
The HTML places the objects, the CSS colors them, and the JS gives them life.
These are the core elements that compose the logic of the dashboard:
- Structural Base
- DOM Elements (variables referencing the HTML elements that will be dynamically updated)
- Data Storage (objects holding data that can be accessed easily by different functions)
- Geospatial Visualization
- Map Initialization
- Adding Layers (basemap + additional layers)
- Adding Legend (adds the fixed legend)
- Map Initialization
- Data Management
- Data Loading (fetch the data)
- Utilities (helper functions performing repetitive tasks)
- Interactive Logic
- Core Logic (updates the map with bbox, performs calculations, and creates dashboard responsiveness with the filter and button)
- Events (listeners for user actions like clicking a button or hovering over the map)
- Render Functions (translates raw data into visual format)
- Initialization (ensures all the functions are ready to go)
//------------------ DOM Elements ------------------//
const sportFilter = document.getElementById('sportFilter');
const refreshBtn = document.getElementById('refreshFilters');
const kpiDistance = document.getElementById("kpi-distance");
const kpiElev = document.getElementById("kpi-elev");
const kpiPace = document.getElementById("kpi-pace");
//------------------ Data Storage ------------------//
const activityData = {}; // sport_type → array of latlngs
const activityMeta = {}; // sport_type → array of {date, elevation, distance, moving_time, country, name}
let chart;
//---------------- Map Initialization ---------------//
const map = L.map('map').setView([0, 0], 2);
// Base Map
L.tileLayer('https://{s}.basemaps.cartocdn.com/light_all/{z}/{x}/{y}{r}.png', {
attribution: '© OSM © CARTO',
subdomains: 'abcd',
maxZoom: 19
}).addTo(map);
// Heatmap Layer
const heatLayer = L.heatLayer([], {
radius: 8, blur: 7, maxZoom: 17, minOpacity: 0.4,
gradient: { 0: 'blue', 0.25: 'cyan', 0.5: 'lime', 0.75: 'yellow', 1: 'red' },
max: 1
});
// Polyline Layer
const polylineLayer = L.layerGroup().addTo(map);
// Layer Control
const layerControl = L.control.layers({}, { "Routes": polylineLayer, "Density Heatmap": heatLayer }).addTo(map);
//Legend
const legend = L.control({ position: 'bottomleft' });
legend.onAdd = function(map) {
const div = L.DomUtil.create('div', 'leaflet-control-legend');
div.innerHTML = `
Activity Density
LowHigh
`;
return div;
};
// Legend Toggle Behavior
map.on('overlayadd', function(e) {
if (e.layer === heatLayer) {legend.addTo(map);}
});
map.on('overlayremove', function(e) {
if (e.layer === heatLayer) {map.removeControl(legend);}
});
//------------------ Utilities ------------------//
const m2km = m => m / 1000;
const secToPace = sec => {
if(!isFinite(sec) || sec<=0) return "--:--";
const m = Math.floor(sec/60), s = Math.round(sec%60).toString().padStart(2,'0');
return `${m}:${s}`;
};
const secToHMS = (sec) => {
const hours = Math.floor(sec / 3600);
const minutes = Math.floor((sec % 3600) / 60);
const seconds = Math.round(sec % 60);
return [
hours > 0 ? hours.toString().padStart(2, '0') : null,
minutes.toString().padStart(2, '0'),
seconds.toString().padStart(2, '0')
].filter(Boolean).join(':');
};
function decodePolyline(str, precision = 5) {
let index = 0, lat = 0, lng = 0, coordinates = [];
const factor = Math.pow(10, precision);
while (index < str.length) {
let b, shift = 0, result = 0;
do { b = str.charCodeAt(index++) - 63; result |= (b & 0x1f) << shift; shift += 5; } while (b >= 0x20);
const dlat = ((result & 1) ? ~(result >> 1) : (result >> 1));
lat += dlat;
shift = 0; result = 0;
do { b = str.charCodeAt(index++) - 63; result |= (b & 0x1f) << shift; shift += 5; } while (b >= 0x20);
const dlng = ((result & 1) ? ~(result >> 1) : (result >> 1));
lng += dlng;
coordinates.push([lat / factor, lng / factor]);
}
return coordinates;
}
//------------------ Core Logic ------------------//
// Filter by sport (Date filter logic removed)
function getFilteredActivities(selectedSport, bounds) {
let acts = [];
const sportsToUse = selectedSport === "all" ? Object.keys(activityMeta) : [selectedSport];
sportsToUse.forEach(sport => {
(activityMeta[sport] || []).forEach((act, idx) => {
if (!act) return;
const activityCoords = activityData[sport] ? activityData[sport][idx] : null;
if (bounds) {
if (!activityCoords) return;
const poly = L.polyline(activityCoords);
if (!poly.getBounds().intersects(bounds)) return;
}
acts.push({
meta: act,
coords: activityCoords,
sport: sport,
index: idx
});
});
});
return acts;
}
// Render Functions
function updateMap(selectedSport) {
polylineLayer.clearLayers();
let allCoords = [];
const filteredActivities = getFilteredActivities(selectedSport, null);
const currentRoutes = [];
filteredActivities.forEach(activity => {
const meta = activity.meta;
const latlngs = activity.coords;
if (!latlngs) return;
const poly = L.polyline(latlngs, { color: 'blue', weight: 2, opacity: 0.6 }).addTo(polylineLayer);
currentRoutes.push(poly);
allCoords.push(...latlngs);
poly.on('mouseover', function(e) {
L.popup({ offset: L.point(0, -10), closeButton: false, autoClose: false, className: 'route-popup' })
.setLatLng(e.latlng)
.setContent(`
Sport: ${activity.sport}
Date: ${meta.date.toLocaleDateString()}
Distance: ${(meta.distance/1000).toFixed(2)} km
Elevation: ${meta.elevation.toFixed(0)} m
Moving time: ${(meta.moving_time/3600).toFixed(2)} h
Name: ${meta.name || 'N/A'}
`)
.openOn(map);
});
poly.on('mouseout', () => map.closePopup());
});
if (currentRoutes.length > 0) {
const featureGroup = L.featureGroup(currentRoutes);
const bounds = featureGroup.getBounds();
if (bounds && bounds.isValid()) map.fitBounds(bounds, { padding: [20,20] });
}
if (allCoords.length > 0) {
const pointMap = {};
allCoords.forEach(([lat, lng]) => {
const key = lat.toFixed(5) + ',' + lng.toFixed(5);
pointMap[key] = (pointMap[key] || 0) + 1;
});
const maxCount = Math.max(...Object.values(pointMap));
const heatPoints = Object.entries(pointMap).map(([key, count]) => {
const [lat, lng] = key.split(',').map(Number);
const intensity = 0.3 + 0.7 * (Math.log(count + 1) / Math.log(maxCount + 1));
return [lat, lng, intensity];
});
heatLayer.setLatLngs(heatPoints);
if (!map.hasLayer(heatLayer)) map.addLayer(heatLayer);
} else {
if (map.hasLayer(heatLayer)) map.removeLayer(heatLayer);
}
}
function renderKPIs(selectedSport, bounds = null) {
const acts = getFilteredActivities(selectedSport, bounds).map(a => a.meta);
const totalDist = acts.reduce((s,a)=>s+(a.distance||0),0);
const totalTime = acts.reduce((s,a)=>s+(a.moving_time||0),0);
const totalElevation = acts.reduce((s,a)=>s+(a.elevation||0),0);
const totalKm = m2km(totalDist);
const totalHours = totalTime/3600;
const avgPace = totalDist > 0 ? (totalTime/totalKm) : NaN;
kpiDistance.textContent = totalKm.toFixed(1);
kpiElev.textContent = `${totalElevation.toFixed(0)} m`;
kpiPace.textContent = secToPace(avgPace);
}
function renderPersonalBests(selectedSport, bounds = null) {
const tableBody = document.getElementById('personal-bests-table');
tableBody.innerHTML = `PB Type Value Date Activity Name No activities found in the selected area. Longest Distance ${m2km(pbs.longestDistance.value).toFixed(2)} km ${pbs.longestDistance.date ? pbs.longestDistance.date.toLocaleDateString() : '--'} ${pbs.longestDistance.name || '--'} Longest Duration ${secToHMS(pbs.longestDuration.value)} ${pbs.longestDuration.date ? pbs.longestDuration.date.toLocaleDateString() : '--'} ${pbs.longestDuration.name || '--'} This is the final stage of the sport dashboard development.
Now it's your turn! Build your own sport dashboard and transform your data
into meaningful insights.
Interested in the full implementation? Explore the complete source code on GitHub and start building your own version today.